Gini Coefficient Calculator
To calculate the Gini Coefficient, divide the area between the Lorenz curve and the line of equality by the total area under the line of equality.
To calculate the Gini Coefficient, divide the area between the Lorenz curve and the line of equality by the total area under the line of equality.
The Gini Coefficient Calculator is a valuable tool for assessing inequality in economic or social contexts. It provides a numerical measure, where 0 represents perfect equality (everyone has the same income or wealth) and 1 indicates maximum inequality (one individual has all the income or wealth).
G = A / (A + B)
| Variable | Description |
|---|---|
| G | Gini Coefficient |
| A | Area between Lorenz curve and line of equality |
| A + B | Total area under the line of equality |
Example 1: Gini Coefficient Calculation for a Population
| Step | Value |
|---|---|
| Area Between Lorenz Curve (A) | 0.25 |
| Total Area (A + B) | 0.50 |
| Gini Coefficient (G) | 0.25 ÷ 0.50 = 0.50 |
Example 2: Gini Coefficient for Another Dataset
| Step | Value |
|---|---|
| Area Between Lorenz Curve (A) | 0.10 |
| Total Area (A + B) | 0.50 |
| Gini Coefficient (G) | 0.10 ÷ 0.50 = 0.20 |
A Gini Coefficient Calculator is a powerful tool which is used to measure income or wealth inequality within a population. By analyzing the distribution of resources, the Gini Coefficient provides a numerical value between 0 and 1, where 0 indicates perfect equality and 1 indicates maximum inequality.
This calculator simplifies complex computations, such as deriving the Gini index formula from the Lorenz curve. It can also assist with calculating Gini coefficients in Excel, SPSS, or other statistical tools.
For instance, a Gini Coefficient of 0.5 suggests moderate inequality, and the calculator provides context for interpreting this value.
Tools like the Gini index calculator online or Gini coefficient by country databases make it accessible for global comparisons and policy assessments.
Ultimately, the Gini Coefficient Calculator is an indispensable resource for analyzing inequality with precision. It simplifies calculations, supports diverse applications, and fosters a deeper understanding of socioeconomic disparities.

14 / 100 SEO Score To calculate the limit of a multivariable function as the variables approach specific values, evaluate the function’s behavior as each variable approaches its corresponding value. This involves analyzing how the function behaves from multiple directions in the domain. Multivariable Limit Calculator Enter the function and the point to calculate the…

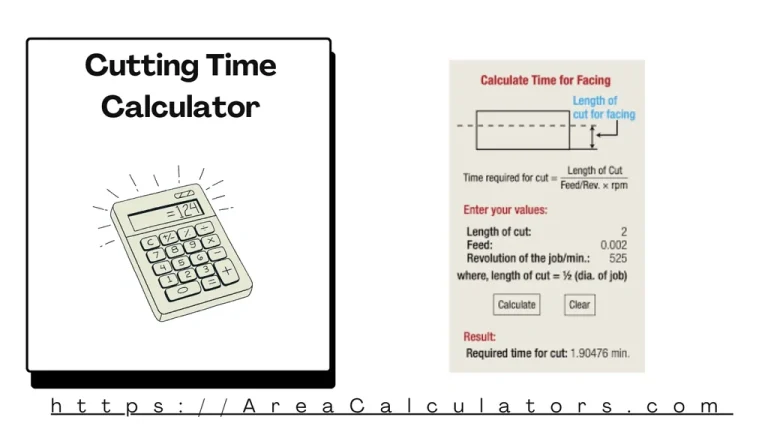
To determine cutting time, divide the length of the material being cut by the cutting speed. The Cutting Time Calculator is a crucial tool for machinists, engineers, and manufacturers to estimate the time required for machining operations. By inputting the length of the material and the cutting speed, this calculator provides precise time estimations, optimizing…
To calculate the weight of a cardboard box, multiply its length (L), width (W), and height (H) and divide by 166 to account for the dimensional weight factor. The Cardboard Box Weight Calculator helps determine the dimensional weight of a cardboard box, which is essential for shipping and packaging. This tool is particularly useful for…
![Gauge To Inches Calculator [ Sheet Metal Gauge Size, MM- 2025 ] 3 Measuring gauge to inches, steel thickness calculator, gauge to inches conversion for metal, thickness calculator for gauges, area calculator for metal gauge and thickness.](https://areacalculators.com/wp-content/uploads/2025/07/gauge-to-inches-calculator-768x432.png)
The Gauge To Inches Calculator converts material thicknesses measured in gauge to their equivalent in inches. It simplifies the process of understanding thickness across various units, helping with tasks like selecting sheet metal, wire, or other materials. Whether working with steel, sheet metal, or wire gauges, this calculator ensures precision in your measurements. Formula T…
To calculate DC voltage from AC voltage, multiply the AC voltage by 0.636. This formula applies to converting RMS AC voltage to its approximate DC equivalent in rectified circuits. AC to DC Voltage Calculator Total Alternating Current Voltage (Volts) DC Voltage from AC Voltage (Volts) Calculate Reset The AC ↔ DC Voltage Calculator simplifies the…
Multiply the length, width, and material strength of the plywood to estimate its load capacity. The Plywood Load Capacity Calculator is an essential tool for anyone working on construction, shelving, or DIY projects. It allows you to determine how much weight a plywood sheet can support, ensuring safety and efficiency. Formula LC = L ∗…